Infographics + Data Visualization
Technical, conceptual, and data-driven illustrations crafted strategically and creatively to visually communicate sophisticated concepts, clarify intricate information, and engage audiences effectively.
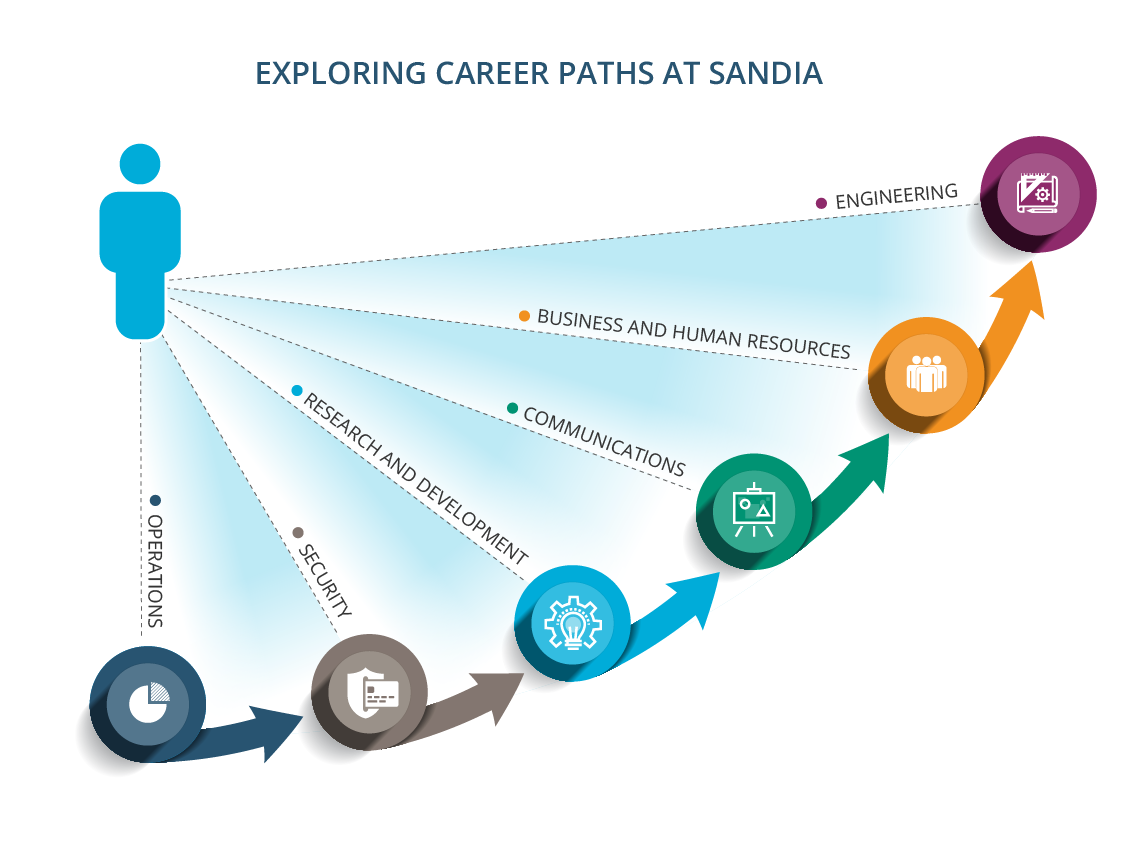
Career recruitment infographic highlighting the variety of career paths at Sandia. ©Sandia National Laboratories

Infographic detailing phased research expansion goals. © UC San Diego
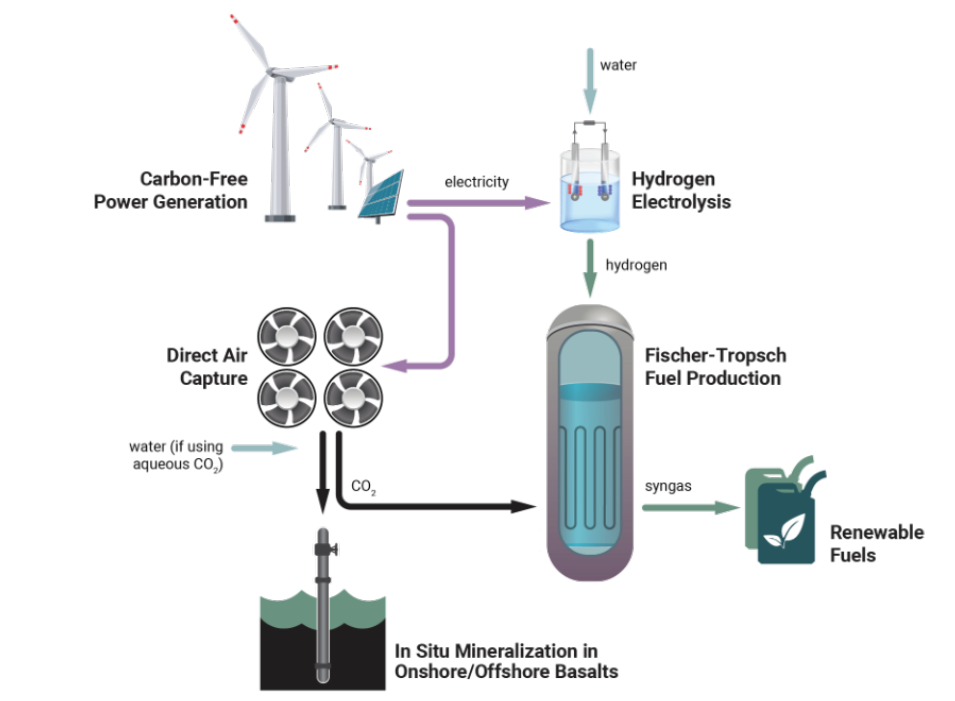
Diagrammatic depiction of in situ mineralization in onshore/offshore basalts; illustration of Fischer-Tropsch fuel production technology. © Jami Butler for EFI
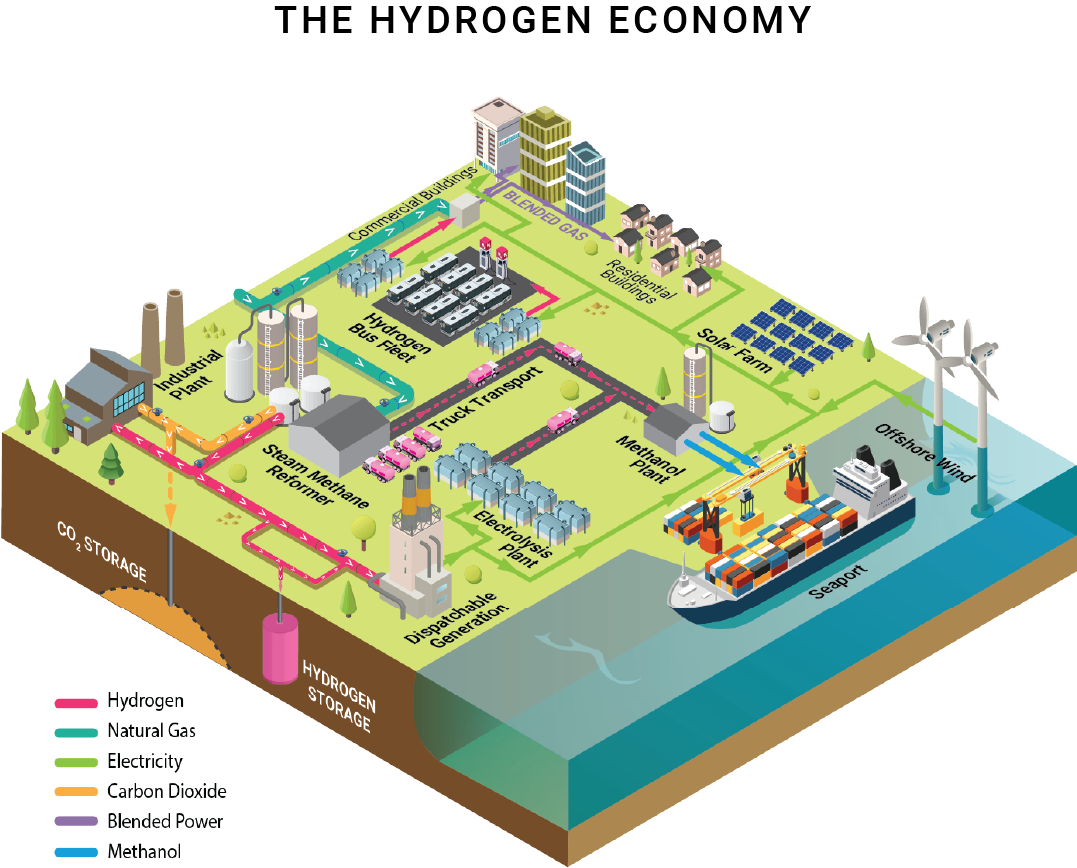
Isometric illustration depicting the hydrogen economy. Built with stock components and custom-created elements using isometric system. © Jami Butler for EFI