Infographics + Data Visualization
Infographics and data visualizations designed to make complex technical and scientific information accessible and engaging.
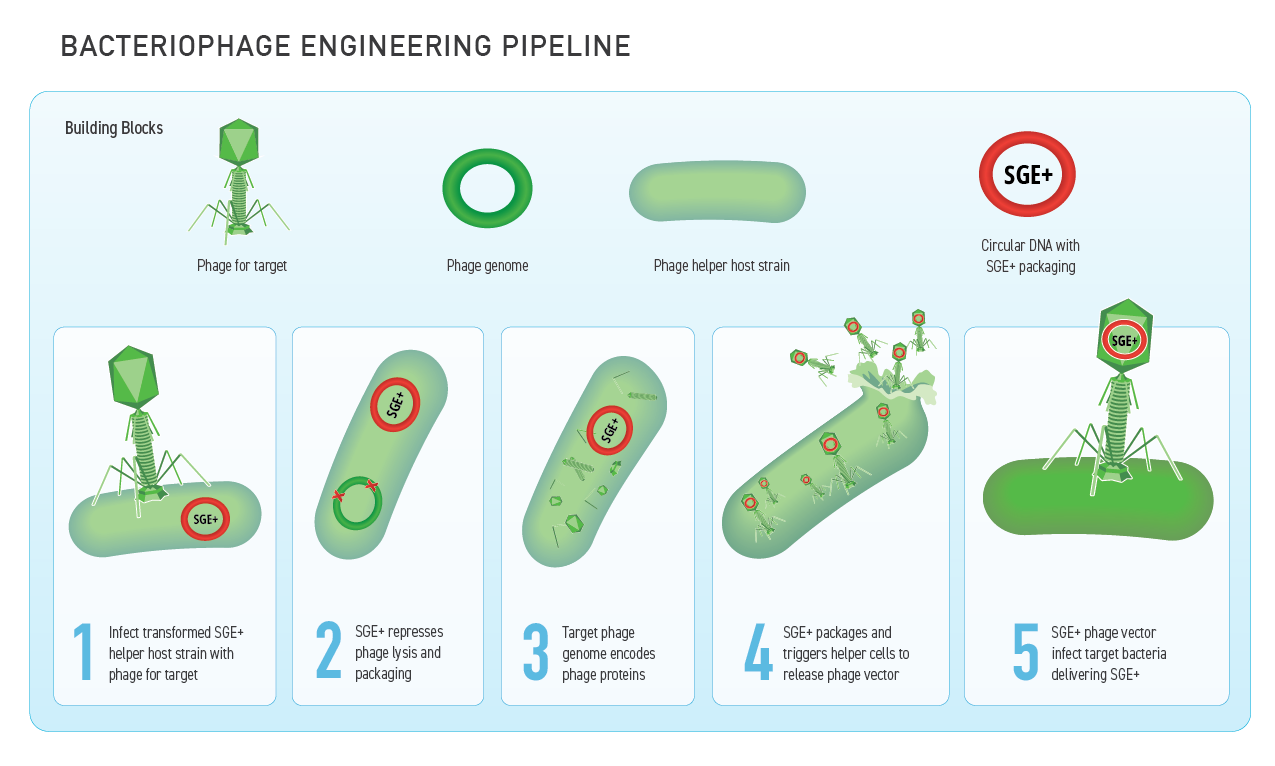
Scientific diagram illustrating the bacteriophage engineering pipeline from initial components through targeted genetic delivery.
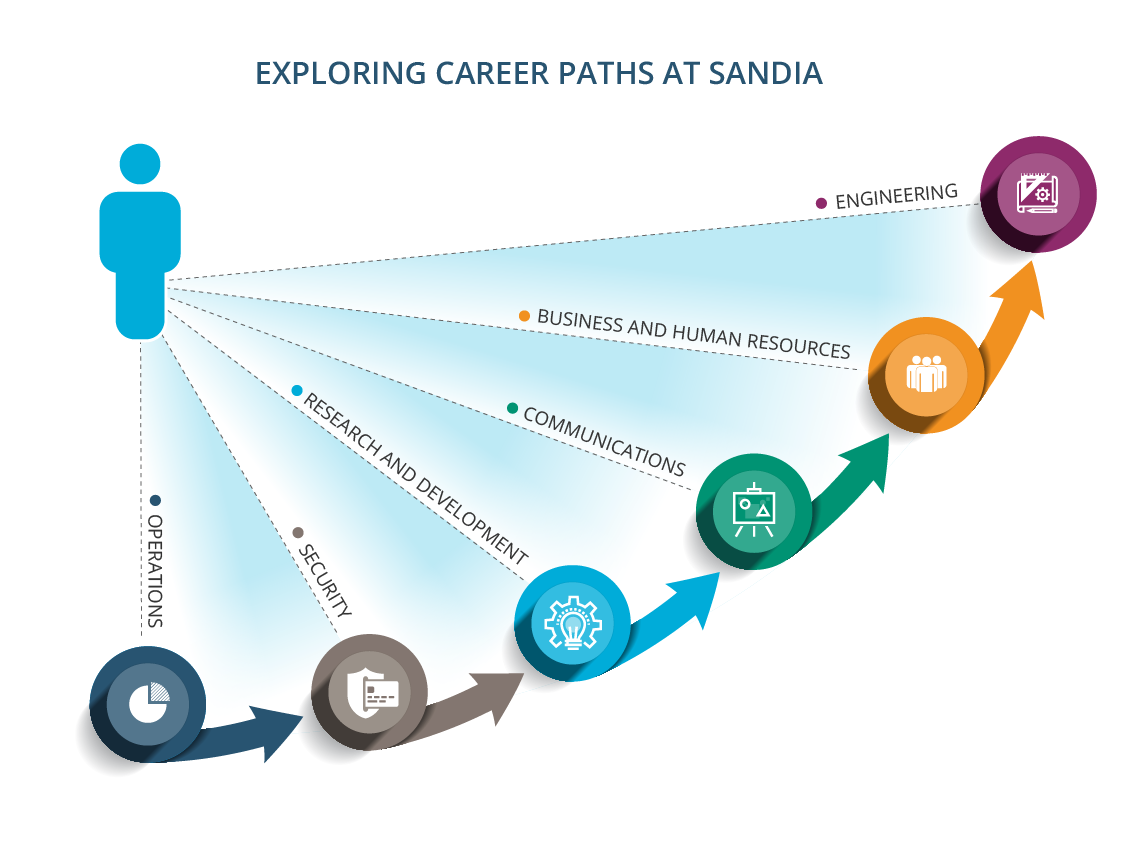
Career recruitment infographic highlighting the variety of career paths at Sandia.

Infographic detailing phased research expansion goals.
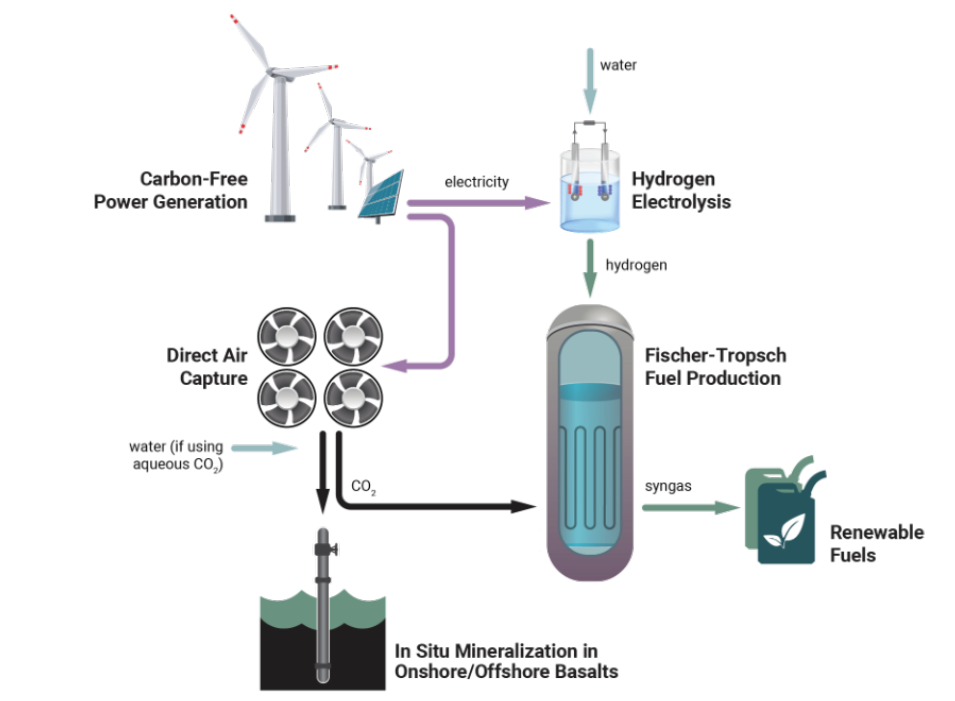
Diagrammatic depiction of in situ mineralization in onshore/offshore basalts; illustration of Fischer-Tropsch fuel production technology.
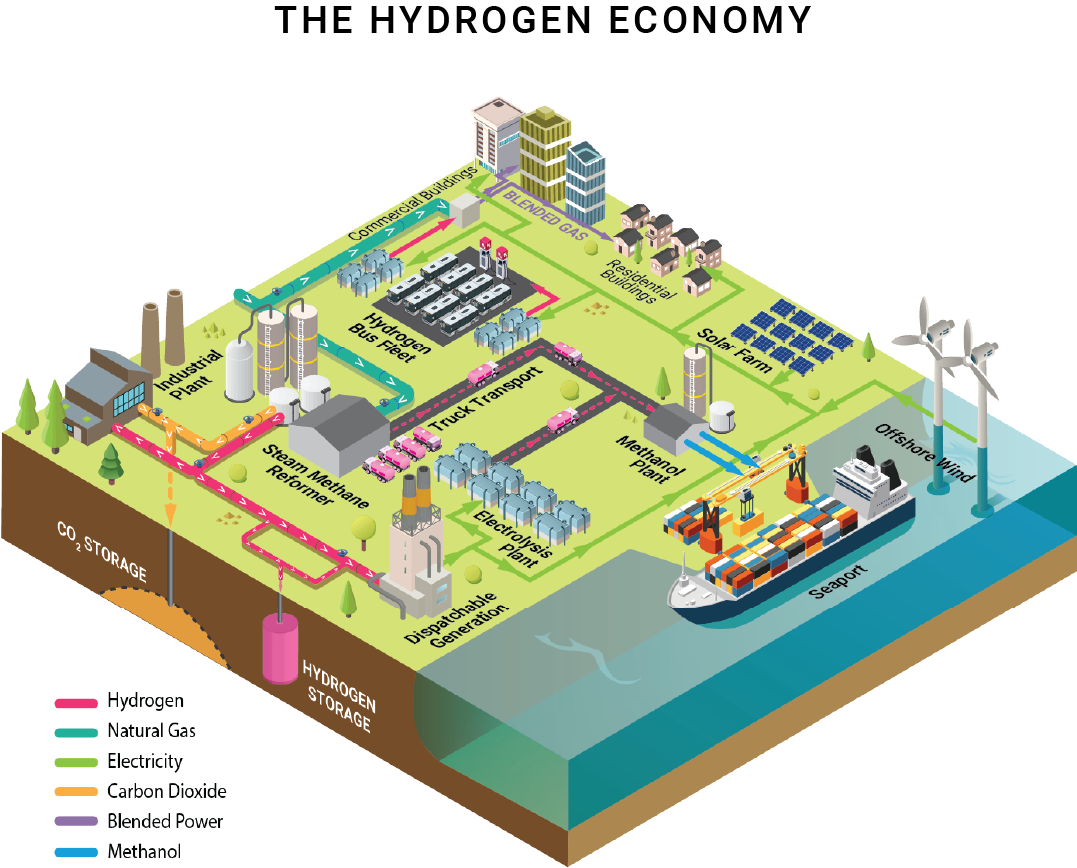
Isometric illustration depicting the hydrogen economy. Built with stock components and custom-created elements using isometric system.